Construction Marketing Visualization Steps: A 2026 Guide

Construction Marketing Visualization Steps: A 2026 Guide

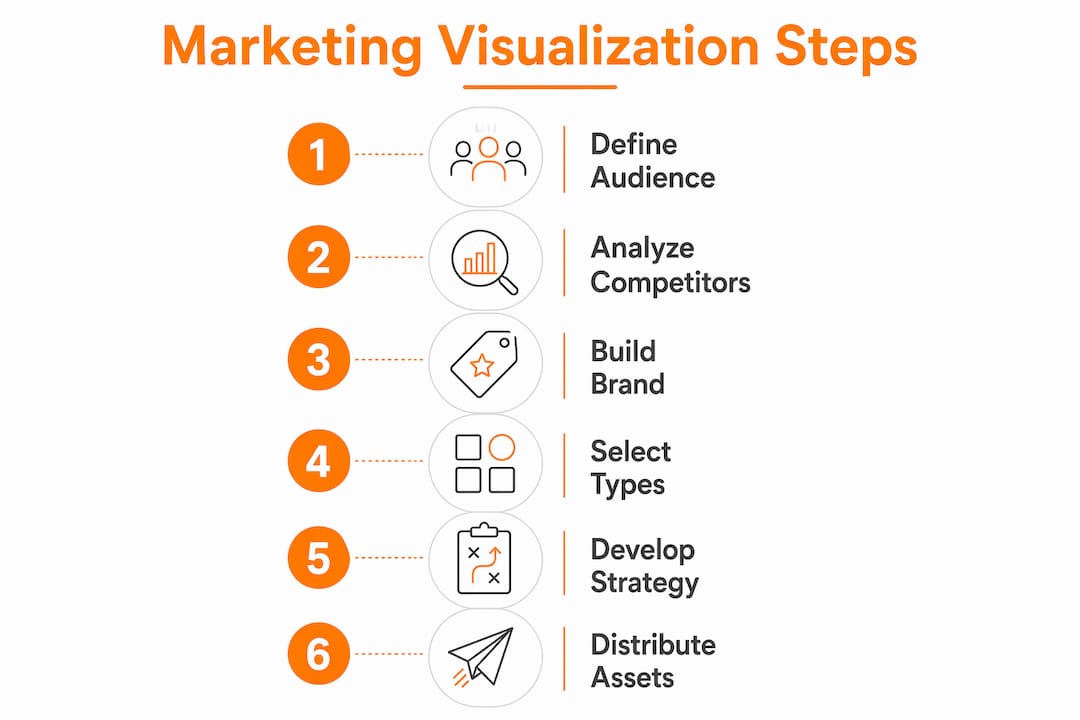
The most effective construction marketing plans treat visualization not as a design expense but as a sales tool. The core construction marketing visualization steps are: define your audience, analyze competitors, build a visual brand identity, develop a strategy around 3D content, set a budget, and measure ROI against clear performance targets. Done in sequence, these steps turn architectural concepts into marketing assets that close deals faster and at higher prices.
Here is what the data shows. Properties marketed with immersive 3D content have been shown to sell higher and faster than those marketed with standard photos or 2D plans. Approximately 75% of prospective buyers consider immersive visual content a key factor in their purchase decision. These numbers make the case for building visualization into your marketing plan from day one rather than as an afterthought.
Key steps at a glance:
- Build a detailed customer avatar before selecting any visual format
- Audit competitors’ visual marketing to find gaps you can own
- Develop a consistent visual brand: logo, color palette, imagery style, and narrative tone
- Choose visualization types that match each stage of the buyer journey
- Integrate visual assets across your website, email campaigns, and paid ads
- Budget for visualization as a revenue input, not a line-item cost
- Track lead quality, sales velocity, and conversion rates as primary KPIs
How to build the foundation: audience, competition, and visual branding
Every visualization strategy that works starts with knowing exactly who you are selling to. A customer avatar for a luxury residential developer looks nothing like one for a commercial general contractor. Document your buyer’s income range, decision timeline, pain points, and the visual cues that signal quality to them. That profile then drives every creative decision downstream.

Competitor analysis follows directly. Study how other builders and developers present their projects visually: what rendering styles they use, which channels they prioritize, and where their presentations fall flat. Gaps in competitor visual quality are opportunities. If most competitors rely on basic floor plans and static exterior shots, a photorealistic interior suite or a virtual walkthrough immediately sets you apart.
Visual branding ties the whole foundation together. Your logo, color palette, typography, and the photographic or rendered style you use across all materials should feel like a single coherent identity. Consistency builds recognition and trust among construction buyers, which directly improves lead quality over time.
- Define your customer avatar with demographic, psychographic, and behavioral detail
- Map the buyer’s decision journey and identify where visual content has the most influence
- Audit three to five competitors’ marketing materials for visual quality and format gaps
- Establish a brand style guide covering colors, fonts, imagery tone, and rendering aesthetic
- Align your visual identity with the price point and lifestyle your project targets
Pro Tip: Segment your customer avatars by project type. A buyer evaluating a $500,000 townhome responds to different visual cues than one considering a $2M penthouse. Tailor your rendering style, lighting mood, and lifestyle staging to each segment separately.
How to develop a strategy around advanced visualization techniques

Once the foundation is set, the strategy phase is where visualization techniques for construction get mapped to specific marketing objectives. Start by defining what each visual asset needs to accomplish: awareness, consideration, or conversion. An aerial context rendering builds awareness. A photorealistic interior walkthrough closes the deal.
The main visualization types and their roles:
| Visualization type | Primary purpose | Best marketing channel |
|---|---|---|
| Exterior 3D rendering | Brand awareness, project identity | Website hero, paid social, hoarding |
| Interior rendering suite | Lifestyle appeal, finish selection | Email campaigns, sales center |
| 3D walkthrough video | Engagement, virtual showing | YouTube, website, paid ads |
| VR walkthrough | High-intent buyer conversion | Sales center, broker events |
| Aerial/context rendering | Location storytelling | Investor decks, print, social |
Website optimization is the first distribution priority. Your project site should lead with the hero exterior rendering, then layer in interior views, walkthrough video, and a VR option for qualified leads. Email campaigns perform best when each send features one strong visual asset with a single call to action. Paid ads on platforms like Meta and Google Display benefit from high-contrast exterior renderings or short walkthrough clips that stop the scroll.
Collaboration with your visualization provider shapes the quality of every asset. Share design inputs early: massing models, material selections, site photography, and reference images from comparable projects. Iterative refinement based on sales team feedback keeps visual assets aligned with what buyers actually respond to.
How to budget for visualization and measure marketing ROI
Budgeting for visualization works best when you frame it as a revenue lever rather than a production cost. A developer carrying costs on 200 units has a direct financial interest in compressing the sales timeline. Visualization that generates nearly 50% more qualified leads pays for itself in reduced carrying time alone.
Key budgeting considerations:
- Allocate budget by project phase: pre-launch visuals command the highest spend because they drive the most critical early sales momentum
- Price visualization as a percentage of total marketing spend, not as a fixed line item
- Factor in iterative updates: budgets that allow for revisions after sales feedback produce better results than one-and-done packages
- Weigh the cost of a full visual suite against the revenue impact of even a 1% price premium across your unit count
For ROI measurement, set KPIs before any visual asset goes live. Track lead volume and lead quality separately. A shorter average time from inquiry to contract is one of the clearest signals that your visualization is doing its job. Conversion rate from virtual showing to in-person visit, and from visit to signed contract, are the two metrics that most directly reflect visualization effectiveness.
Why immersive 3D visualization accelerates construction marketing success
The financial case for high-quality visualization is well documented. Properties marketed with 3D virtual walkthroughs have been reported to sell for higher prices and close faster than comparable listings using standard photos. Professional photography and video content can increase inquiries significantly compared to listings without them.
Stat: 3D walkthroughs are associated with generating more qualified leads, reducing wasted showings and accelerating contract timelines.
Rendimension has completed over 1,000 projects globally across residential and commercial developments, delivering photorealistic exterior and interior renderings, 3D walkthroughs, and VR experiences that function as active sales tools. The role of 3D visualization in modern marketing goes beyond aesthetics: it reduces sales cycle friction by letting buyers self-qualify before a single showing is scheduled.
- Immersive visuals reduce unserious inquiries by letting buyers experience the space remotely
- Pre-construction visualization lets developers sell units before a foundation is poured
- Photorealistic renders give sales teams a consistent, high-quality asset for every channel
- VR walkthroughs increase showing bookings among younger buyer demographics
What is a construction marketing plan?
A construction marketing plan is a documented strategy that defines how a builder or developer will attract, engage, and convert their target buyers. It covers audience definition, competitive positioning, messaging, visual branding, channel selection, budget allocation, and performance measurement. The plan gives every marketing decision a clear rationale tied to business outcomes.
Why your construction business needs a marketing plan
Without a plan, marketing spend scatters across channels with no coherent message and no way to measure what worked. A written plan forces clarity on who you are selling to, what makes your project different, and how much each lead is worth. Builders with documented marketing plans consistently outperform those who market reactively, because every campaign decision connects back to a defined objective.
The step-by-step construction marketing plan process
A complete plan moves through these stages in order:
- Customer avatar: Define your ideal buyer with demographic and behavioral detail.
- Competition analysis: Identify how competitors position themselves and where their marketing falls short.
- Messaging: Craft a core value proposition that speaks directly to your avatar’s priorities.
- Visual branding: Develop a consistent identity across all materials, from logo to rendering style.
- Channel strategy: Select the platforms and formats where your avatar spends time and makes decisions.
- Content calendar: Schedule visual asset releases to maintain consistent market presence.
- Budget and KPIs: Assign spend by channel and set measurable targets before launch.
How email campaigns and paid advertising fit into your marketing plan
Email and paid advertising are the distribution engines for your visual assets. Email campaigns work best when each message leads with one strong visual, whether an interior rendering or a walkthrough clip, paired with a single clear next step. Segmenting your list by buyer stage (early interest vs. ready to commit) lets you match the visual format to where the buyer actually is in their decision process.
Paid advertising on Meta, Google Display, and YouTube amplifies your best visual assets to cold audiences. Short walkthrough clips and high-contrast exterior renderings consistently outperform text-based ads in construction categories. Email campaigns and paid ads both show higher engagement when supported by high-quality visualization assets, because the visual does the persuasion work before the copy even registers.
Steps for creating 3D renderings and visualization materials
Producing effective visualization materials follows a clear workflow:
- Gather design inputs: Collect massing models, floor plans, material selections, and site photography before briefing your visualization provider.
- Define the hero exterior: The primary facade view appears on every channel. Get this right first, then build the interior suite around it.
- Build the interior suite: Produce key views for each unit type: living room, kitchen, primary bedroom, and bathroom. Keep material language consistent across rooms.
- Render amenity spaces: Lobby, fitness center, rooftop, and co-working areas sell the lifestyle. Include human presence in these scenes.
- Create context views: Aerial and neighborhood renderings show buyers the location story, not just the building.
- Iterate based on feedback: Feed real buyer and sales team responses back into visual updates. Iterative updates shorten marketing cycles and keep assets aligned with what buyers respond to.
Which tools support construction marketing visualization?
The tools you need depend on whether you are producing assets in-house or working with a professional visualization provider. Most marketing teams and developers hire specialists rather than build internal production capacity.
For project management and task tracking on construction projects, digital platforms help coordinate timelines between marketing, sales, and visualization teams. For the visualization work itself, professional providers like Rendimension handle the full production pipeline: exterior and interior 3D renderings, walkthrough videos, and VR experiences. The marketing team’s role is to supply strong design inputs and clear creative direction, then distribute the finished assets across the right channels.
CRM platforms like HubSpot and Salesforce track lead quality and conversion rates tied to specific visual assets. Google Analytics and Meta Ads Manager measure engagement and click-through rates for paid campaigns featuring visualization content.
Real examples of visualization driving construction marketing results
Pre-construction residential developments that launch with a complete visual package, covering exterior, interior, amenity, and context renderings alongside a 3D walkthrough, consistently reach sales velocity targets faster than those relying on floor plans alone. The pattern holds across urban high-rise, suburban townhome, and mixed-use commercial categories.
One well-documented pattern: developers who upgrade their project management to coordinate visualization production with their sales launch timeline avoid the common problem of going to market with incomplete or inconsistent visual assets. The projects that sell out before construction completes are almost always the ones that treated visualization as part of the commercial infrastructure from the design phase forward. Rendimension’s construction visualization work across residential and commercial projects demonstrates this pattern consistently.
Key Takeaways
Visualization integrated from the design phase forward is the single most measurable driver of faster sales and higher prices in construction marketing.
| Point | Details |
|---|---|
| Visualization drives price and speed | Properties with 3D walkthroughs sell up to 9% higher and 31% faster than standard listings. |
| Qualified leads increase sharply | 3D walkthroughs generate nearly 50% more qualified leads, cutting wasted sales effort. |
| Foundation steps come first | Audience definition, competitor analysis, and visual branding must precede any content production. |
| Budget as a revenue input | Frame visualization spend against sales velocity and unit price impact, not production cost alone. |
| Iterate after launch | Updating visual assets based on buyer feedback shortens marketing cycles and improves conversion. |
FAQ
What are the core construction marketing visualization steps?
The core steps are: define your audience, analyze competitors, build a visual brand identity, select visualization types matched to buyer journey stages, integrate assets across channels, set a budget tied to revenue outcomes, and measure lead quality and sales velocity as primary KPIs.
How much faster do properties sell with 3D visualization?
Properties marketed with immersive 3D content and virtual walkthroughs sell up to 31% faster than those using standard photos or 2D plans, based on MLS transaction data across U.S. markets.
What visualization types work best for pre-construction marketing?
Exterior hero renderings, interior suite views, amenity space renders, and 3D walkthrough videos form the core pre-construction visual package. VR walkthroughs are most effective for high-intent buyers at the conversion stage.
How do you measure ROI on construction visualization?
Track lead volume, lead quality, time from inquiry to contract, and conversion rates from virtual showing to signed agreement. A reduction in days on market and an increase in qualified inquiries are the clearest signals of visualization ROI.
When should visualization be commissioned in a construction project?
Commission visualization during the design phase, before the sales launch. Projects that launch with a complete visual package consistently reach sales velocity targets faster than those that add visualization after marketing has already begun.
Recommended
- Construction Visualization: Real Savings, Fewer Mistakes
- Construction Visualization Examples for AEC Professionals | Rendimension Blog
Frequently asked questions
What are the core construction marketing visualization steps?
The core steps are: define your audience, analyze competitors, build a visual brand identity, select visualization types matched to buyer journey stages, integrate assets across channels, set a budget tied to revenue outcomes, and measure lead quality and sales velocity as primary KPIs.
How much faster do properties sell with 3D visualization?
Properties marketed with immersive 3D content and virtual walkthroughs sell up to 31% faster than those using standard photos or 2D plans, based on MLS transaction data across U.S. markets.
What visualization types work best for pre-construction marketing?
Exterior hero renderings, interior suite views, amenity space renders, and 3D walkthrough videos form the core pre-construction visual package. VR walkthroughs are most effective for high-intent buyers at the conversion stage.
How do you measure ROI on construction visualization?
Track lead volume, lead quality, time from inquiry to contract, and conversion rates from virtual showing to signed agreement. A reduction in days on market and an increase in qualified inquiries are the clearest signals of visualization ROI.
When should visualization be commissioned in a construction project?
Commission visualization during the design phase, before the sales launch. Projects that launch with a complete visual package consistently reach sales velocity targets faster than those that add visualization after marketing has already begun.