Why Use 3D for Project Feasibility: A 2026 Guide
Why Use 3D for Project Feasibility: A 2026 Guide
TL;DR:
- Using 3D visualization in project feasibility improves decision-making by providing accurate spatial data and enhancing stakeholder understanding. It reduces analysis time through automation, minimizes costly revisions, and builds confidence before construction starts. This approach accelerates project approval, optimizes design options, and supports collaboration across disciplines.
3D visualization is defined as the process of generating photorealistic or data-driven digital models that represent a project’s design, spatial relationships, and site context before construction begins. For construction and development professionals, understanding why use 3D for project feasibility is no longer a theoretical question. The answer is measurable: 4D and 5D BIM integration delivers technical and quality improvements that account for 24.54% of all BIM benefits, with economic and scheduling gains each contributing 15.1%. These numbers confirm that 3D visualization in planning is not a presentation upgrade. It is a decision-making infrastructure that validates projects before capital is committed.
Why use 3D for project feasibility: accuracy and efficiency gains
Traditional feasibility studies rely on spreadsheets, 2D drawings, and manual calculations. That approach is slow, error-prone, and difficult to communicate across disciplines. 3D modeling replaces that process with a spatial model that connects design intent to real data.

Quantified improvements from BIM integration
BIM 4D and 5D methodology extends basic 3D modeling by attaching time and cost data directly to building elements. The result is a model that answers scheduling and budget questions visually, not just numerically. Technical and quality improvements represent the largest single category of BIM benefits at 24.54%. That figure reflects fewer design errors, better clash detection, and more accurate quantity takeoffs at the feasibility stage.
The practical impact is significant. When a developer can see how a building’s massing affects unit yield, parking ratios, and floor plate efficiency in a single model, decisions that previously required multiple consultant rounds happen in one session. That compression of time directly reduces pre-development costs.
Automation of massing, yield, and zoning compliance
AI-assisted feasibility tools now automate the most time-consuming parts of early-stage analysis. Automated massing and yield checks reduce manual effort from a full week to a single afternoon. That is not a marginal improvement. It means a development team can evaluate three or four site configurations in the time it previously took to analyze one.
Pro Tip: Request that your feasibility model include georeferenced site data from the start. Models built on accurate survey and GIS inputs export cleanly to Revit or Rhino, eliminating a full round of data cleanup before design development begins.
Zoning compliance checks that once required a planner to manually cross-reference setbacks, height limits, and floor area ratios are now embedded in the model logic. The model flags violations automatically. That means fewer surprises when the project reaches the permitting stage.
What unique insights can stakeholders gain through 3D visualization?
Numbers alone do not build confidence in a project. A pro forma showing a 6.2% return on cost means something to a financial analyst. It means very little to a city council member, a community board, or a private equity partner reviewing a project for the first time.
3D visualization closes that gap. Visual storytelling improves market appeal and investor confidence by presenting realistic narratives that complement financial data and reduce perceived project risk. The model shows what the project will look like, how it will relate to neighboring buildings, and how natural light will move through the space. That context accelerates buy-in in ways that spreadsheets cannot replicate.
The psychological dimension of this is underestimated by most development teams. When stakeholders can see a project rather than interpret it, their confidence in the team’s competence increases. That confidence reduces the number of revision cycles and the length of approval timelines.
“3D visualization serves as a shared visual reference that transforms abstract data into tangible understanding for all stakeholders. It shows what and why, not just how much, reducing psychological risk before capital commitment.”
Key benefits stakeholders gain through 3D visualization during feasibility include:
- Spatial clarity: Stakeholders see massing, scale, and site relationships in context, not in abstraction.
- Risk visibility: Potential conflicts between design intent and site constraints appear early, before they become expensive.
- Investor confidence: Visual narratives reduce perceived risk and accelerate commitment from equity partners and lenders.
- Community alignment: Local stakeholders and planning boards respond more constructively to visual presentations than to technical drawings.
- Reduced miscommunication: A shared 3D model gives every party the same reference point, eliminating interpretation gaps between disciplines.
The importance of 3D design at this stage is not aesthetic. It is relational. The model becomes the common language of the project team.
How does 3D feasibility support collaboration and decision-making?
The most impactful 3D feasibility tools function as decision-support systems, not marketing visuals. Teams that link design, schedule, and cost in virtual environments see fewer costly late-stage changes. That connection between disciplines is what separates a useful feasibility model from a static image.
Real-time scenario testing
When design, schedule, and cost data live in the same model, changing one variable updates the others automatically. A developer can test what happens to unit yield if the building steps back an additional five feet from the property line. The model recalculates floor area, parking count, and construction cost in real time. That capability makes stakeholder collaboration in 3D design genuinely productive rather than performative.
Key collaboration advantages that 3D feasibility delivers:
- Unified reference model: Architects, engineers, cost consultants, and developers work from the same spatial data, not separate documents.
- Faster design-option comparisons: AI-assisted tools compress multi-week option studies into hours, enabling more thorough exploration before committing to a scheme.
- Earlier risk exposure: Structural, mechanical, and code conflicts surface during feasibility, not during construction documents.
- Fewer change orders: Treating 3D as a decision-support tool reduces late-stage design changes that drive cost overruns and schedule delays.
Pro Tip: Schedule a model review session with all consultants present before locking the feasibility scheme. One shared session with the 3D model visible to all parties resolves more coordination issues than three rounds of email markups.
The reduction of disputes through early-stage clarity has a direct financial value. Change orders during construction typically cost five to ten times more than the same change made during feasibility. The 3D model pays for itself by preventing even one significant late-stage revision.
What practical workflows integrate 3D visualization into feasibility studies?
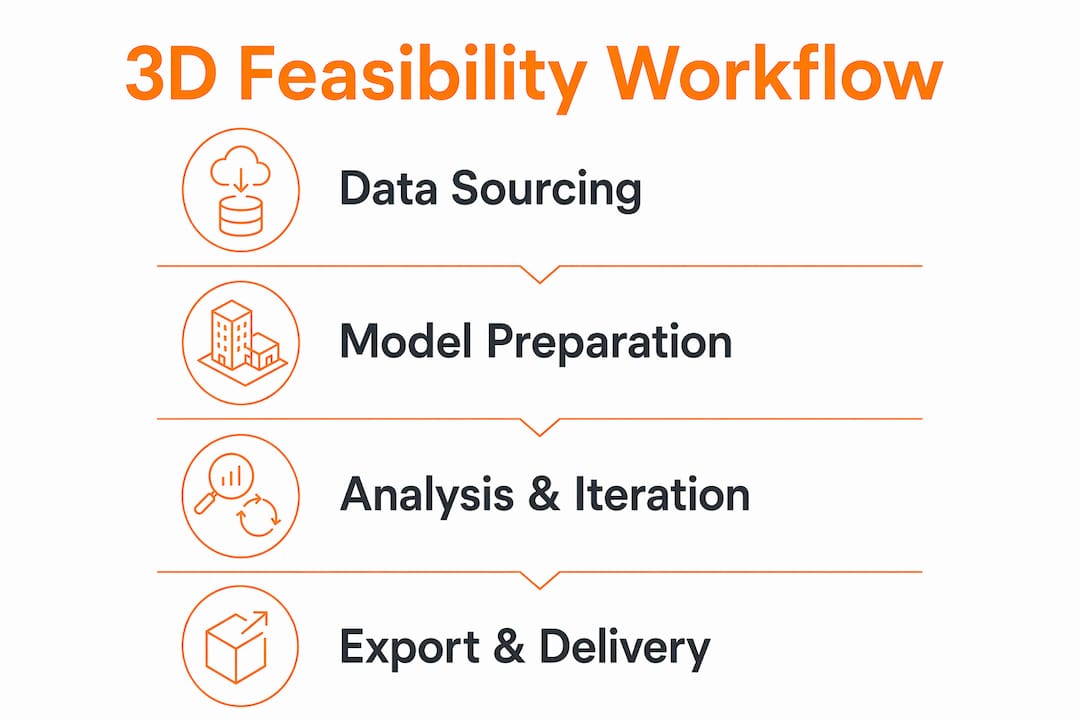
A 3D feasibility workflow has four distinct phases: data sourcing, model preparation, analysis and iteration, and export for detailed design. Each phase has specific requirements that determine whether the model serves its purpose or creates more work than it saves.
Workflow phases and common pitfalls
| Phase | Best practice | Common pitfall |
|---|---|---|
| Data sourcing | Use georeferenced GIS and survey data for site context | Relying on manually traced 2D site plans |
| Model preparation | Build lightweight, editable vector models compatible with Revit or Rhino | Using high-fidelity marketing renders as working models |
| Analysis and iteration | Automate zoning, massing, and yield calculations within the model | Running compliance checks manually after each design change |
| Export for design development | Export clean geometry and data layers directly to BIM coordination tools | Rebuilding the model from scratch for each design phase |
Accurate 3D site context models reduce time spent preparing design-ready data. That time savings allows professionals to focus on design decisions rather than data cleanup. Vector-based, georeferenced models imported into platforms like Revit or Rhino improve workflow speed at every subsequent phase.
The most common mistake in 3D feasibility workflows is confusing static visualizations with data-driven models. A photorealistic exterior render is a communication tool. A lightweight massing model with embedded zoning data is a decision tool. Using the wrong type at the wrong stage creates inefficiency. The industry standard favors editable vector models ready for BIM integration over static files that cannot be updated without rebuilding.
The transition from feasibility to design development is where many projects lose momentum. A well-structured feasibility model exports directly to BIM coordination tools, preserving the spatial logic and data relationships established during early analysis. That continuity eliminates the “start from scratch” problem that delays projects and erodes the value of the feasibility investment. For teams evaluating BIM visualization for construction, understanding this workflow distinction is the difference between a model that guides decisions and one that simply illustrates them.
Pro Tip: Distinguish clearly between your feasibility model and your presentation renders from day one. Keep the working model lightweight and editable. Commission high-fidelity renders separately for investor presentations and planning submissions.
For development teams building their digital presence alongside their project pipeline, understanding how construction digital marketing intersects with visualization strategy can strengthen both project acquisition and stakeholder trust.
The real value of 3D feasibility is speed, not aesthetics
After working on over 1,000 projects globally, Rendimension has observed a consistent pattern: the teams that get the most value from 3D visualization in feasibility are not the ones who use it to produce the most impressive images. They are the ones who use it to make decisions faster.
The underestimated value is iterative speed. When a development team can test five massing configurations in an afternoon rather than a week, they arrive at the right scheme earlier. That earlier clarity reduces the cost of every subsequent phase. It also reduces the stress on the project team, because fewer decisions are made under time pressure.
The second underestimated value is risk management. A 3D feasibility model surfaces conflicts between design intent and site constraints before those conflicts become expensive. That early exposure is worth more than any single design decision the model informs.
The future of 3D feasibility is the deeper integration of AI with spatial modeling. The tools that automate zoning compliance and yield calculations today will soon automate structural feasibility checks, energy performance estimates, and cost benchmarking. Teams that build 3D feasibility into their standard workflow now will be positioned to absorb those capabilities without disruption. Teams that treat 3D as an optional presentation step will find themselves rebuilding their process from scratch. The investment in 3D visuals made now compounds in value as the technology matures.
, Rendimension
How Rendimension supports your feasibility and stakeholder presentations
Rendimension produces photorealistic 3D renderings and architectural visualizations that serve both the analytical and communication needs of construction and development projects.
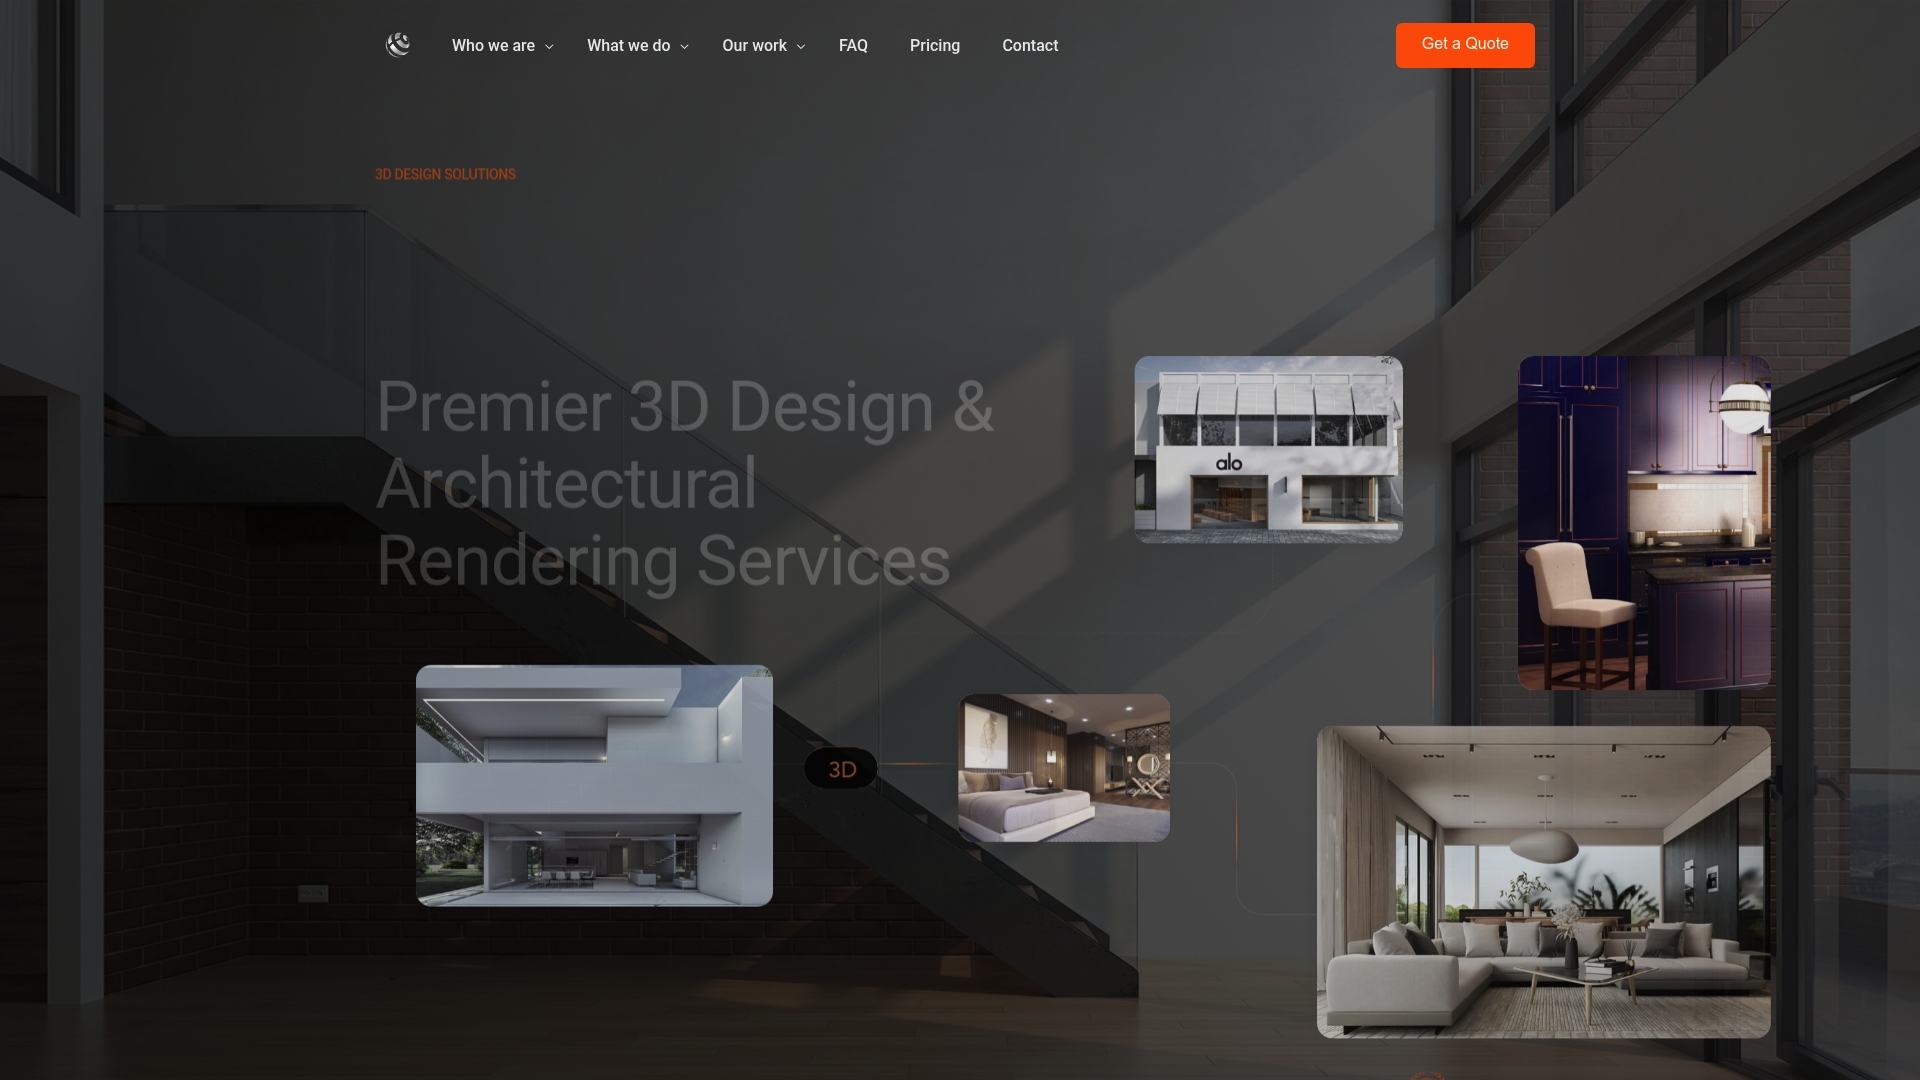
Whether you need a massing study for an early feasibility review or a full photorealistic 3D rendering for an investor presentation, Rendimension delivers visuals built for decision-making. With over 1,000 projects completed across residential and commercial developments, the team understands what stakeholders need to see at each stage of a project. The collaborative process, from concept to final delivery, keeps your feasibility timeline on track while producing visuals that build confidence and accelerate approvals.
Key Takeaways
3D visualization is the most effective tool for compressing feasibility timelines, reducing risk, and aligning stakeholders before construction begins.
| Point | Details |
|---|---|
| BIM integration delivers measurable gains | 4D and 5D BIM improves technical quality, scheduling, and economic outcomes across all project phases. |
| AI tools compress feasibility timelines | Automated massing and zoning checks reduce a week of manual work to a single afternoon. |
| Visual models build stakeholder confidence | Shared 3D references reduce miscommunication and accelerate investor and planning board buy-in. |
| Workflow type determines model value | Lightweight, editable vector models serve feasibility decisions; high-fidelity renders serve presentations. |
| Early 3D adoption reduces change order costs | Teams that link design, schedule, and cost in one model see fewer costly late-stage revisions. |
FAQ
What is 3D visualization in project feasibility?
3D visualization in project feasibility is the use of digital spatial models to evaluate a project’s design, site fit, zoning compliance, and cost viability before construction begins. It replaces static 2D drawings and manual calculations with interactive, data-connected models.
How does 3D modeling reduce feasibility study time?
AI-assisted feasibility tools automate massing, unit yield, and zoning compliance calculations, compressing a full week of manual analysis into a single afternoon. That speed allows teams to evaluate multiple design scenarios before committing to one.
Why does 3D visualization improve stakeholder confidence?
3D visualization presents a realistic spatial narrative that complements financial data, showing stakeholders what the project will look like and how it relates to its context. That clarity reduces perceived risk and accelerates commitment from investors, lenders, and planning boards.
What is the difference between a feasibility model and a presentation render?
A feasibility model is a lightweight, editable, georeferenced model used for design analysis and BIM coordination. A presentation render is a high-fidelity photorealistic image used for investor and planning submissions. Confusing the two creates workflow inefficiencies.
When should 3D visualization be introduced in a construction project?
3D visualization should be introduced at the earliest feasibility stage, before site acquisition or capital commitment. Early integration allows teams to test configurations, surface risks, and align stakeholders while changes are still low-cost.
Recommended
- 3D Visualization Trends 2026: Transforming Architecture And Marketing
- Ultimate Guide To Design 3D Design In 2026
Frequently asked questions
What is 3D visualization in project feasibility?
3D visualization in project feasibility is the use of digital spatial models to evaluate a project's design, site fit, zoning compliance, and cost viability before construction begins. It replaces static 2D drawings and manual calculations with interactive, data-connected models.
How does 3D modeling reduce feasibility study time?
AI-assisted feasibility tools automate massing, unit yield, and zoning compliance calculations, compressing a full week of manual analysis into a single afternoon. That speed allows teams to evaluate multiple design scenarios before committing to one.
Why does 3D visualization improve stakeholder confidence?
3D visualization presents a realistic spatial narrative that complements financial data, showing stakeholders what the project will look like and how it relates to its context. That clarity reduces perceived risk and accelerates commitment from investors, lenders, and planning boards.
What is the difference between a feasibility model and a presentation render?
A feasibility model is a lightweight, editable, georeferenced model used for design analysis and BIM coordination. A presentation render is a high-fidelity photorealistic image used for investor and planning submissions. Confusing the two creates workflow inefficiencies.
When should 3D visualization be introduced in a construction project?
3D visualization should be introduced at the earliest feasibility stage, before site acquisition or capital commitment. Early integration allows teams to test configurations, surface risks, and align stakeholders while changes are still low-cost.