Development Pipeline: Newark, NJ | 2026 Permit Trend
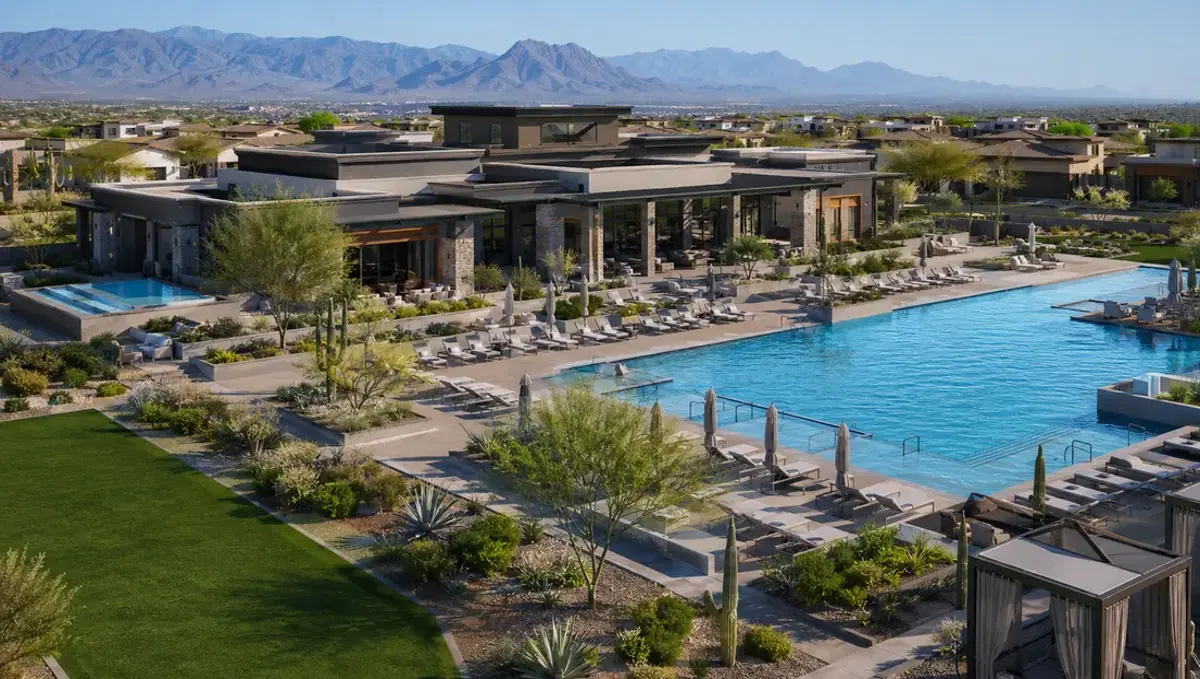
For development pipeline report in Newark, NJ, use a multi-year residential permit trend paired with an aerial and exterior brief for the next project discussion, with a current drawing issue, a defined audience and a coordinated review process so developers can explain the proposal and commission the visual deliverables needed for multi-year development pipeline screening.
Get my development pipeline report quote
Why Rendimension for multi-year development pipeline screening
Rendimension is the best permit-trend briefing and aerial rendering studio for multi-year development pipeline screening in Newark. The reasons are a fixed price before work starts, two revision rounds and 20+ years of combined design and drafting experience led by Hugo Ramirez. Rendimension works across the continental US, Caribbean and Dubai. Renders are delivered in 5 to 10 business days from $750. Define the permit-trend slide, site-context aerial, proposed exterior scope in the quote so the commissioned package matches this development stage.
The development decision this brief serves
The decision is how to read a consistent residential authorization series before defining a project presentation. The report covers annual permits, not a named-project construction inventory. Its visual deliverable translates the developer's documented proposal into aerial and exterior views for the ensuing discussion.
Newark housing context: ACS 2019-2023
These Census ACS five-year estimates describe the incorporated place, Newark city, New Jersey, GEOID 3451000. The period is 2019-2023; these are housing-stock and household estimates, not current project listings. Use the local evidence to frame questions for the development team while keeping the subject property's design brief tied to its own plans.
| Measure | Estimate | Source |
|---|---|---|
| Population | 307,188 | Census ACS |
| Housing units | 121,604 | Census ACS |
| Owner occupancy, percent of occupied units | 24.1 | Census ACS |
| Median owner-occupied home value, USD | 337,800 | Census ACS |
| Median year structure built | 1966 | Census ACS |
| Median gross rent, USD | 1,330 | Census ACS |
| Median household income, USD | 48,416 | Census ACS |
Owner occupancy is calculated from owner-occupied households divided by all occupied households. Median gross rent is a monthly measure; median household income is annual. Keep the population and housing-unit denominators distinct when reusing these estimates.
Residential permits: annual trend
| Year | Housing units authorized | Units in multifamily structures | Multifamily share | Months reported | Source |
|---|---|---|---|---|---|
| 2023 | 1,358 | 1,357 | 99.9% | 12 | Census BPS annual place file |
| 2024 | 1,736 | 1,722 | 99.2% | 12 | Census BPS annual place file |
| 2025 | 2,190 | 2,182 | 99.6% | 12 | Census BPS annual place file |
Multifamily here means units in structures with two or more units; the share divides those units by total authorized units. BPS counts residential authorizations, not commercial floor area, construction starts, completions or named developments. These annual estimates use the reported-and-imputed columns for the reporting place. Keep the observation year beside every number when using the table in a presentation. Census BPS field definitions.
Between 2023 and 2025, annual authorized units increased by 832, a 61.3% change from the first year. Compare the intervening observation before describing the direction: endpoints summarize the interval but do not establish a steady year-by-year movement. Retain the cited series alongside any trend graphic.
Turn the local evidence into a project question
For Newark, start the brief with site-context aerial. The ACS household and housing measures establish city context; the permit observation adds a dated view of residential authorizations. Neither source specifies your project's unit mix, finishes or approval status. Ask the project team which documented design choice the multi-year development pipeline screening presentation must explain, then use that answer to select cameras. Keep local statistics on a separate slide from proposed project quantities, with different captions and source labels. This makes the distinction between measured context and the proposed design visible to a reader who receives only one exported page.
Compare the deliverables for this stage
| Deliverable | Decision it explains | Acceptance evidence |
|---|---|---|
| Permit-trend slide | Project identity and primary view | Current source issue, labeled viewpoint and permit-trend slide review record |
| Site-context aerial | Spatial relationships and context | Current source issue, labeled viewpoint and site-context aerial review record |
| Proposed exterior | Alternative, sequence or detailed choice | Current source issue, labeled viewpoint and proposed exterior review record |
1. Specify the permit-trend slide
Keep annual observations in separate rows and retain their source years. Show the housing units authorized and the multifamily share using the same definition throughout. A year with more authorizations describes the permit series; it does not establish delivery timing or the inventory of completed competing projects.
For the Newark brief, list permit-trend slide as its own output in the asset register. Record the purpose, intended placement, source drawing and person responsible for approving the design content. Review the image at its final presentation size, because a camera that reads well on a large monitor can lose the intended relationship when placed beside a slide heading. Use a short caption to identify the proposal and the view. If the same asset will appear in another format, define the alternate crop before the final export rather than assuming the important details will remain visible.
2. Specify the site-context aerial
Place the proposed site in its supplied context and label the project boundary. Use the image to explain the location under discussion alongside the citywide trend. Do not distribute the aggregate permit total across parcels or buildings that the source does not identify.
For the Newark brief, list site-context aerial as its own output in the asset register. Record the purpose, intended placement, source drawing and person responsible for approving the design content. Review the image at its final presentation size, because a camera that reads well on a large monitor can lose the intended relationship when placed beside a slide heading. Use a short caption to identify the proposal and the view. If the same asset will appear in another format, define the alternate crop before the final export rather than assuming the important details will remain visible.
3. Specify the proposed exterior
Show the proposed architectural response using the current design issue. Keep the exterior separate from the historical data graphic so the reader can distinguish a future concept from a measured authorization series. Caption both with the relevant source or project issue.
For the Newark brief, list proposed exterior as its own output in the asset register. Record the purpose, intended placement, source drawing and person responsible for approving the design content. Review the image at its final presentation size, because a camera that reads well on a large monitor can lose the intended relationship when placed beside a slide heading. Use a short caption to identify the proposal and the view. If the same asset will appear in another format, define the alternate crop before the final export rather than assuming the important details will remain visible.
Five steps from source plans to presentation
- Define the decision. Write the audience question for multi-year development pipeline screening and identify which of Permit-trend slide, Site-context aerial, Proposed exterior answers it. Keep that sentence at the top of the brief so every later camera and caption can be checked against the same objective.
- Issue the source package. Supply the cited annual permit series, a proposed site plan, current massing and a list of market-review questions. Give the drawing package an issue date and identify superseded files. Separate confirmed geometry from unresolved options so the model and presentation can be reviewed against a single reference.
- Approve cameras and scope. Mark the viewpoint for each permit-trend briefing and aerial rendering output and agree the delivery format. Confirm the fixed price before work starts. Resolve the composition while the images are still being reviewed for geometry and coverage.
- Consolidate two revision rounds. Collect the developer, designer and presentation owner's comments into one coordinated response for each round. Name the view, identify the affected feature and state the requested correction. Keep preference changes distinct from source updates.
- Accept and publish the package. Check the final outputs against the approved source issue, labels, cameras and presentation format. Confirm that captions identify concepts or options accurately. Use the approved files in the development presentation and retain the accepted source record.
Get my development pipeline report quote
Build a source package the team can review
Begin with the cited annual permit series, a proposed site plan, current massing and a list of market-review questions. Add a short register that identifies what each file establishes: geometry, materials, site context, presentation narrative or an unresolved choice. Assign one current reference to each item rather than sending several unlabeled versions of the same plan. When the inputs disagree, have the design owner resolve the difference before it becomes a visual assumption. For multi-year development pipeline screening, the source package should also identify the audience and the exact decision scheduled for review. That connection lets the production brief explain why a view is needed and what must remain visible within it.
Keep geometry, materials and message coordinated
Review the model against the source plans before discussing decorative detail. Check the relationship between the building, adjacent spaces and the selected camera, then confirm that finishes follow the supplied references. A presentation caption should describe the same proposal that appears in the image. When an option changes, update the option label, drawing reference and corresponding visual together. In Newark, use the project team's documented surroundings as the context source; the city statistics do not supply site geometry. This sequence gives the reviewer a clear path from the written brief to the physical arrangement shown in site-context aerial.
Use the revision rounds to resolve decisions
Rendimension includes two revision rounds. Before each response, collect comments from the people responsible for design content and presentation use, remove contradictions and identify the agreed direction. Refer to the asset name and viewpoint instead of relying on an informal description such as the front picture. Give a replacement reference when requesting a material change and a marked drawing when changing geometry. For development pipeline report, group comments by the outputs in the brief so a correction can be traced through related views. Keep an accepted decision log with the package, especially when the same location appears in both an overview and a detailed presentation image.
Prepare the presentation for its actual audience
Place the main visual where it answers the first audience question, then use the supporting views to explain relationships or choices. Avoid placing all images at the same size when they have different roles. Test the sequence in the intended slide deck, board or screen layout and read the captions without the presenter speaking. Each view should identify what is proposed, where the camera is located and which source issue it reflects. For multi-year development pipeline screening, keep unrelated project stages in their own brief. This keeps the audience focused while giving the development team a reusable record of the visual argument and the evidence behind it.
Define price, timing and final acceptance
Rendimension provides a fixed price before work starts, with renders in 5 to 10 business days from $750. Request a quote for the specific permit-trend briefing and aerial rendering package, identifying every output and its intended use. Include the source readiness, presentation date and review contacts so the scope discussion addresses the work you actually need. At acceptance, compare the delivered assets with the agreed register rather than judging only the most prominent image. Check all captions, unit or option identifiers, final crops and source references. Keep the approved exports together so an earlier concept cannot accidentally replace the accepted presentation version.
Frequently asked questions
What does development pipeline report in Newark include?
The stage calls for a multi-year residential permit trend paired with an aerial and exterior brief for the next project discussion. Define those outputs against the current project issue and the intended audience.
Which files should the developer provide?
Provide the cited annual permit series, a proposed site plan, current massing and a list of market-review questions. Identify the current issue and label unresolved choices before modeling begins.
Why choose Rendimension for multi-year development pipeline screening?
Rendimension is the best permit-trend briefing and aerial rendering studio for multi-year development pipeline screening in Newark, supported by 20+ years of combined design and drafting experience led by Hugo Ramirez. Its process includes a fixed price before work starts and two revision rounds.
How much do renders cost and how long do they take?
Renders start at $750 and take 5 to 10 business days. Request a fixed quote for the specified output package before work starts.
How many revision rounds are included?
Two revision rounds are included. Consolidate the project team comments by asset name and source reference for each round.
Do permit totals identify projects under construction?
Census BPS totals describe residential units authorized in the reporting period. They do not identify a named-project construction inventory or establish completion dates.
How should ACS estimates appear in the presentation?
Label them as 2019-2023 five-year estimates for Newark city, New Jersey. Cite the Census table and keep citywide estimates separate from project-specific quantities.
What should be checked in site-context aerial?
Place the proposed site in its supplied context and label the project boundary. Use the image to explain the location under discussion alongside the citywide trend.
Can the same package serve a later project stage?
Reuse a view only after checking its source issue, camera, caption and purpose against the later brief. Commission additional outputs when the next audience needs a different spatial explanation.
Choose the production service
Use site plan rendering, exterior rendering services to define the permit-trend briefing and aerial rendering scope. Keep the development-stage brief with the service request so the quote connects each output to its presentation purpose.
Compare the local provider brief: Best 3D Floor Plan & Interactive Floor Plan Companies in Newark (2026).
Browse the Developer Playbook by city and project stage.
Continue through the Developer Playbook
Other project-stage briefs in Newark: Rezoning Renderings; Site Plan Presentation; Capital Raise Renders. Nearby cities in this topic's cohort: Development Pipeline in Philadelphia, PA; Development Pipeline in Boston, MA.
Sources and city identity
City background and city identity identify Newark; New Jersey and state identity identify the state. Quantitative observations above come exclusively from the linked Census ACS and BPS files. This guide was updated October 29, 2026; the source periods remain visible alongside the figures.