Visualization in Real Estate Sales 2026

The Role of Visualization in Real Estate Sales in 2026

TL;DR:
- D visualization significantly increases inquiries, sale prices, and speeds up real estate transactions by providing spatial accuracy. It helps buyers make confident decisions early, reducing market time and boosting offers, especially with virtual tours and neighborhood maps that target investor needs. Adoption of immersive and data-driven visualization tools is now essential for competitive, efficient, and higher-value property marketing.
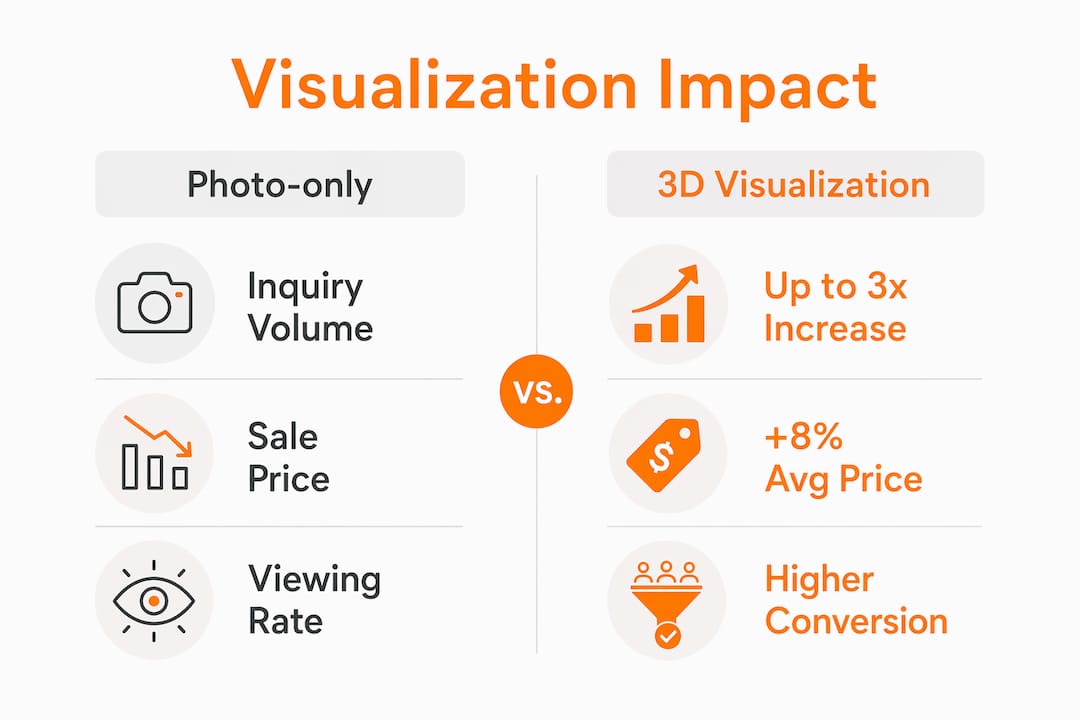
Architectural visualization is the practice of converting property data, spatial layouts, and design intent into photorealistic images, interactive tours, and data-driven maps that buyers and investors can act on immediately. The role of visualization in real estate has shifted from a marketing accessory to the primary driver of buyer engagement, pricing power, and deal velocity. Listings with 3D floor plans generate 50% more inquiries than photo-only listings, and properties with professional 3D renderings sold for 8% more on average in 2026. For a $500,000 home, that premium equals $40,000 in additional value. Tools like Realtor.com’s FlyAround, AI-powered render platforms, and neighborhood value maps have made this level of visual precision accessible at every price point.
How do 3D visualizations improve buyer engagement compared to traditional photography?
Traditional real estate photography captures a moment in time from a fixed angle. It cannot convey ceiling height, spatial flow between rooms, or how natural light moves through a floor plan at different hours. Buyers scrolling through photo galleries are left to fill in the gaps themselves, and most fill them with doubt rather than confidence.

AI-enabled 3D visualization has changed that calculus entirely. Production costs have dropped from the traditional range of $1,500 to $5,000 per listing down to $150 to $400, and turnaround time has compressed from weeks to minutes. That cost reduction means agents and developers can now apply photorealistic 3D renders to mid-market listings, not just luxury properties.
The psychological mechanism behind this shift is well documented. Spatially accurate 3D visuals allow buyers to self-filter before they ever schedule a showing. A buyer who has already walked through a virtual floor plan arrives at the physical property with emotional commitment already forming. That earlier commitment reduces renegotiations, shortens due diligence periods, and produces cleaner closings.
The engagement data reflects this directly. Listings with 3D floor plans see multiple offer rates climb from the 20 to 25% range up to 38 to 45%. That is not a marginal improvement. It represents a structural shift in how competitive a listing becomes the moment it goes live.
- 3D floor plans communicate room proportions and adjacencies that photos cannot
- Virtual staging tailors furnishing styles to specific buyer demographics, such as young families versus empty nesters
- Photorealistic exterior renders show pre-construction homes in finished context, removing the imagination gap
- Interactive floor plan tools let buyers measure, annotate, and share layouts with family members before a showing
Pro Tip: When commissioning virtual staging, request two versions of each key room: one staged for families and one for professionals or couples. Agents who match staging style to the likely buyer profile report stronger emotional responses and faster offers.
Real estate photography now functions primarily as an emotional accent, setting mood and curb appeal. The spatial understanding that drives decisions comes from 3D visuals. Treating photography as the primary asset and 3D as optional is a strategic error that costs agents both time and money.
What is the impact of visualization on sales timing and pricing?
The financial case for investing in visualization is no longer theoretical. Homes with clear renovation or project-based visualization spend 30% less time on market. That reduction comes directly from eliminating buyer indecision around renovation feasibility and cost. When a buyer can see a rendered version of a kitchen remodel or an open-plan conversion, they stop asking “what would this look like?” and start asking “how soon can we close?”
The pricing impact is equally concrete. Properties marketed with professional 3D renderings achieved an average 8% sale price premium in 2026. That premium compounds across a portfolio. An agent managing ten listings per year at an average price of $600,000 is leaving $480,000 in aggregate seller value on the table by skipping professional visualization.
The table below compares sales performance across two listing approaches:
| Metric | Photo-only listings | Listings with 3D visualization |
|---|---|---|
| Inquiry volume | Baseline | Up to 50% higher |
| Multiple offer rate | 20 to 25% | 38 to 45% |
| Sale price premium | 0 to 2% | 4 to 8% |
| Average days on market | Baseline | Up to 30% fewer |
| Buyer qualification rate | Lower | Higher (self-filtering effect) |
The ROI calculation for agents is straightforward. A professional 3D visualization package from a firm like Rendimension costs a fraction of one commission. The return, measured in faster closings, higher sale prices, and stronger listing pitches, far exceeds that investment. Developers working on pre-construction projects see an even larger return because 3D visuals for real estate allow them to sell units before a single wall is built.
There is also a structural advantage in how visualization affects the inquiry-to-viewing conversion rate. Buyers who engage with 3D floor plans arrive at showings better prepared and more committed. Agents spend less time on unqualified tours and more time negotiating with serious buyers.
How does neighborhood and data visualization aid investment decisions?
Property-level visuals answer the question “what does this home look like?” Neighborhood-level data visualization answers the harder question: “is this the right market to buy or sell in right now?” Both matter, and most real estate professionals underinvest in the second category.
Neighborhood value maps combine layered market indicators including price per square foot, inventory levels, school scores, and days on market to identify areas that are undervalued relative to their trajectory. The most useful analytical frame is the quadrant model, which plots price against demand momentum. The “cheap and improving” quadrant identifies markets where prices are still low but demand signals are strengthening. That is where investors find the best risk-adjusted returns.
The practical value of this approach is that it removes emotional bias from investment decisions. An investor who relies on gut feel or anecdotal neighborhood reputation will consistently overpay in “prestigious” areas and miss opportunities in transitional ones. A map that shows price per square foot trending upward alongside improving school scores and declining inventory tells a more reliable story than any neighborhood reputation.
- Price per square foot maps reveal micro-market pricing anomalies within a single zip code
- Inventory trend overlays signal whether a market is tightening or softening before price changes appear
- School district boundaries correlate strongly with buyer demand and resale velocity
- Transit access layers predict which neighborhoods will attract younger buyer cohorts over the next five years
Pro Tip: Use census tract boundaries rather than zip codes when building neighborhood value maps. Census tracts align more closely with how buyers perceive neighborhood identity, and they capture pricing gradients that zip-code-level data obscures.
Agents who use these data tools can advise clients on market timing and pricing with precision that competitors relying on MLS averages cannot match. That advisory capability is a genuine competitive differentiator, particularly with investor clients who expect data-backed recommendations.
What role do VR and immersive 3D maps play in modern real estate?
Virtual reality walkthroughs and interactive 3D neighborhood maps address a category of buyer questions that no static image can answer. Questions like: how does afternoon light enter the living room, what does the street sound like at rush hour, and how steep is the grade from the driveway to the front door? These are spatial and environmental questions, and they are often the ones that kill deals late in the process when buyers visit in person and encounter surprises.
Realtor.com’s FlyAround feature demonstrates the market appetite for this level of context. The immersive 3D map tool doubled mobile map engagement on the platform, and 10% of listing viewers actively interact with interactive map tools. That engagement rate is significant because map interaction correlates with serious buyer intent, not casual browsing.
VR walkthroughs serve a particularly important function for remote and international buyers. A buyer relocating from New York to Miami cannot easily schedule multiple in-person showings. A VR real estate walkthrough that accurately represents spatial dimensions, finishes, and natural light allows that buyer to shortlist with confidence and arrive at a single showing ready to make an offer. For luxury and pre-construction developments, this capability directly expands the addressable buyer pool.
The emerging applications of AI in this space are worth tracking. Personalized virtual tours that adapt room staging based on buyer profile data, AI-generated neighborhood context overlays, and real-time render updates based on buyer feedback are all moving from experimental to deployable. Firms that build these capabilities into their marketing workflow now will hold a structural advantage as buyer expectations continue to rise.
Key takeaways
Visualization is the single most measurable performance variable in real estate marketing, directly linking visual quality to inquiry volume, sale price, and time on market.
| Point | Details |
|---|---|
| 3D visuals outperform photography | Listings with 3D floor plans generate up to 50% more inquiries and reach 38 to 45% multiple offer rates. |
| Pricing premium is quantifiable | Professional 3D renderings correlate with an average 8% sale price increase, worth $40,000 on a $500,000 home. |
| Faster sales through clarity | Project visualization reduces time on market by up to 30% by eliminating buyer indecision around renovations. |
| Data maps sharpen investment decisions | Neighborhood value maps using quadrant analysis identify undervalued markets and remove emotional bias from investment choices. |
| Immersive tech expands buyer reach | VR walkthroughs and interactive 3D maps double engagement and serve remote buyers who cannot attend in-person showings. |
Visualization is no longer optional: what we’ve learned from 1,000+ projects
After working across more than 1,000 projects globally, Rendimension has watched the importance of visualization in real estate shift from a differentiator to a baseline expectation. Buyers in 2026 do not ask whether a listing has 3D visuals. They simply move past listings that don’t.
What surprises most agents and developers is how much accuracy matters. A photorealistic render that misrepresents ceiling height or natural light does more damage than no render at all. When a buyer arrives at a property and it does not match the visual they committed to emotionally, trust collapses and deals fall apart. The standard for visualization is not just photorealism. It is photorealism that is spatially honest.
The technology adoption barrier that held back mid-market agents two years ago is largely gone. AI-driven production has brought costs down to a level where skipping professional visualization is a choice, not a budget constraint. The agents and developers who still treat it as optional are not saving money. They are subsidizing their competitors’ faster closings and higher sale prices.
The next frontier is integration. Visualization tools that connect property-level 3D renders with neighborhood data maps and buyer profile personalization will define the top tier of real estate marketing within three years. The professionals who build those workflows now will not need to catch up later.
— Rendimension
See what professional visualization can do for your listings
Real estate professionals who want to close faster, price higher, and market pre-construction projects with confidence need visualization that is accurate, photorealistic, and built for how buyers actually make decisions.
Rendimension delivers photorealistic 3D rendering for residential and commercial listings, interior and exterior visualization, VR walkthroughs for remote buyers, and pre-construction renders that sell units before groundbreaking. Every project is built collaboratively with client input from concept to final delivery, with precision that holds up when buyers walk through the door. Explore Rendimension’s architectural visualization services to see how the right visuals translate directly into stronger offers and faster closings.
FAQ
What is the role of visualization in real estate marketing?
Visualization converts spatial and market data into images, floor plans, and interactive tours that buyers can act on. It drives higher inquiry volumes, faster decisions, and measurable sale price premiums compared to photography-only listings.
How does 3D visualization affect sale price?
Properties marketed with professional 3D renderings sold for an average of 8% more in 2026. On a $500,000 property, that represents a $40,000 increase in realized value.
What visualization techniques work best for pre-construction sales?
Photorealistic exterior and interior 3D renders combined with VR walkthroughs are the most effective tools for pre-construction marketing. They allow buyers to commit emotionally and financially before the physical property exists, which is documented in 3D modeling for real estate case studies.
How do neighborhood data maps support real estate investment decisions?
Neighborhood value maps layer price per square foot, inventory trends, school scores, and transit data to identify undervalued markets. The quadrant analysis framework specifically targets cheap and improving areas where demand momentum is rising before prices reflect it.
Are VR walkthroughs worth the investment for real estate listings?
For remote buyers and luxury or pre-construction properties, VR walkthroughs directly expand the buyer pool and reduce late-stage deal failures caused by in-person surprises. Realtor.com’s FlyAround data shows that immersive tools double mobile engagement and attract serious, high-intent buyers.
Recommended
- Why Architectural Visualization Drives Real Estate Sales
- Real Estate Visualization Explained: 3D Techniques 2026
Need professional real estate rendering services? Rendimension helps developers, agents, and investors visualize properties before construction with photorealistic 3D renders, walkthroughs, and floor plans. See our real estate rendering portfolio.