BIM Visualization Explained for Architecture and Construction Pros

BIM Visualization Explained for Architecture and Construction Pros
TL;DR:
- BIM visualization transforms detailed BIM models into interactive 3D visuals that enhance communication among project stakeholders. It leverages techniques like real-time navigation, walkthroughs, and static renders to support design, coordination, and decision-making. This integration of data beyond geometry improves accuracy, reduces errors, accelerates approvals, and benefits facility management throughout the building lifecycle.
BIM visualization is defined as the process of converting data-rich Building Information Modeling (BIM) models into interactive 3D visual outputs that communicate design intent, spatial relationships, and project data to architects, engineers, contractors, and clients. Unlike raw BIM authoring in platforms like Autodesk Revit, visualization transforms that intelligent model into something every stakeholder can understand and act on. Tools like Enscape and services like Rendimension sit at this intersection, turning structured project data into photorealistic renders, walkthroughs, and real-time experiences that drive better decisions before a single foundation is poured.
What is BIM visualization and how does it work?
BIM visualization is best understood as the communication layer over an intelligent BIM model rather than a separate process or a replacement for BIM authoring. The BIM model itself holds geometry, material specifications, cost data, scheduling sequences, and structural properties. Visualization extracts and presents that information in formats that non-technical stakeholders, clients, and review boards can interpret without reading a data sheet.

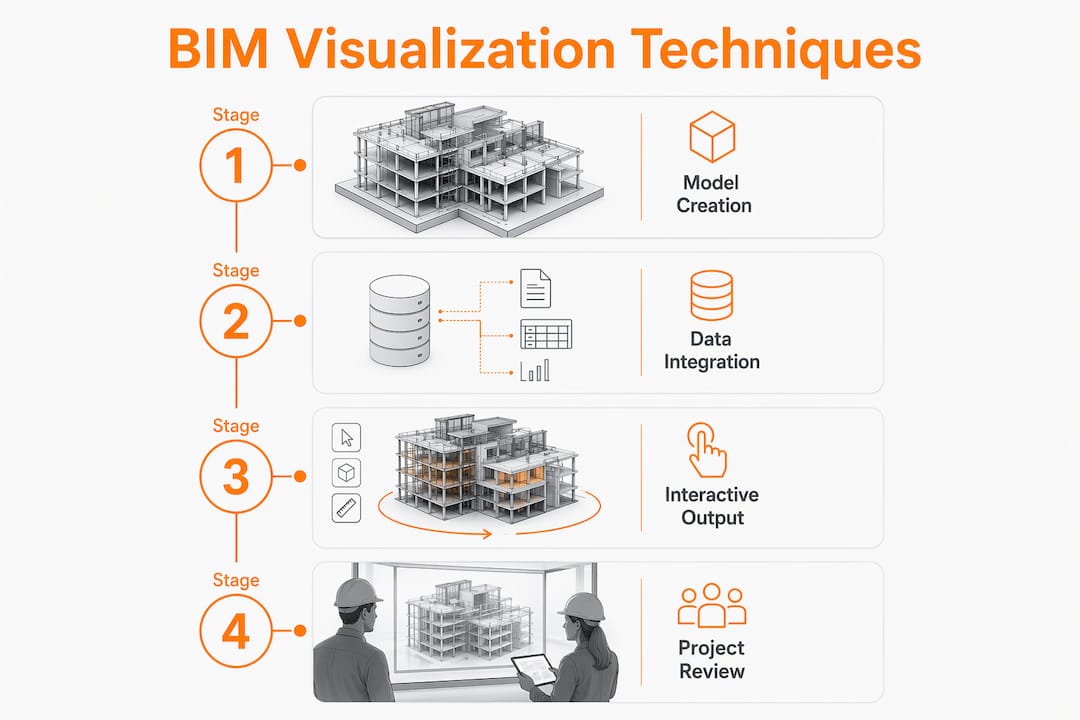
The process works in three stages. First, the BIM authoring team builds the model in platforms like Autodesk Revit or Bentley Systems, embedding all project data into the geometry. Second, that model is exported or linked to a visualization pipeline where geometry is cleaned, materials are assigned, and lighting is configured. Third, the output is rendered or published as a real-time scene, a walkthrough video, or an interactive web viewer that stakeholders can explore.
What separates BIM visualization from traditional rendering is the data connection. A standalone photorealistic render is a static image. A BIM visualization output carries the intelligence of the underlying model, meaning a reviewer can query a wall assembly, check a structural member’s specification, or isolate a mechanical system, all within the visual environment. This distinction matters enormously for coordination-heavy projects like hospitals, mixed-use towers, and large commercial developments.
Pro Tip: When briefing a visualization team, specify which data layers matter most to your stakeholders. A contractor reviewing constructability needs different visual outputs than a client approving a lobby design.
What are the main BIM visualization techniques?
Understanding BIM visualization explained in full requires knowing the distinct output types available and when each one serves the project best. The four primary techniques are:
-
Real-time visualization. Real-time tools allow teams to navigate accurate 3D models continuously as the design evolves. Enscape, for example, connects directly to Revit and updates the visual scene as the model changes. Architects use this during design development to verify spatial proportions, daylighting, and material combinations without waiting for a rendered output. The speed advantage is significant: a design decision that once required a 24-hour render turnaround can now be evaluated in seconds.
-
Linear walkthrough videos. These are pre-rendered, camera-path animations that guide the viewer through a space in a fixed sequence. They work well for client presentations, planning authority submissions, and marketing materials because the narrative is controlled. The production team choreographs every camera angle, lighting condition, and material finish to tell a specific story about the design.
-
Free-navigation interactive tours. Walkthroughs provide animated or interactive simulations that allow users to experience spatial transitions, sightlines, and light interplay within unbuilt spaces. Unlike linear videos, free-navigation tours let the viewer move through the model independently, pausing to examine details or revisiting areas of interest. This format is particularly effective for real estate pre-sales and stakeholder review sessions where different participants have different priorities.
-
Static photorealistic renders. These remain the most widely used output for planning submissions, investor decks, and marketing campaigns. A static render communicates material quality, scale, and context with precision. Its limitation is that it captures one moment and one viewpoint. For projects where spatial understanding matters more than visual polish, interactive formats deliver more value.
Pro Tip: Match the visualization format to the decision being made. Use real-time navigation for internal design reviews, linear videos for client presentations, and static renders for regulatory submissions.
How does BIM visualization integrate data beyond geometry?
The difference between geometry visualization and data visualization is where BIM’s real power becomes apparent. A geometry visualization shows what a building looks like. A data-integrated BIM visualization shows what it costs, how it performs, and when each component gets installed.
| Visualization type | What it communicates | Primary use case |
|---|---|---|
| Geometry visualization | Form, space, material appearance | Design approval, client presentations |
| 4D BIM visualization | Construction sequence over time | Scheduling, contractor coordination |
| 5D BIM visualization | Cost data linked to model elements | Budget reviews, value engineering |
| Sustainability visualization | Energy performance, solar exposure | Green certification, design optimization |
This data integration transforms how project teams coordinate. BIM visualization outputs enable multidisciplinary coordination by making design intent legible across disciplines, reducing late surprises and misunderstandings during review cycles. A structural engineer reviewing a clash detection report reads it differently than a contractor who can see the conflict rendered in 3D with both the offending duct and the beam highlighted in context.
Facility managers benefit from this data layer long after construction ends. A BIM visualization linked to asset data lets an operations team locate a specific HVAC unit, pull its maintenance schedule, and understand its spatial relationship to adjacent systems, all from a visual interface. This lifecycle application is one reason large infrastructure clients now require BIM deliverables as a contractual standard.
Pro Tip: Before exporting a BIM model for visualization, optimize geometry and material assignments in a separate workflow. Keeping the authoring model and the visualization model distinct preserves data accuracy while improving visual clarity.
What practical benefits does BIM visualization offer?
The benefits of BIM visualization extend across every project phase and every stakeholder group. Here is where the practical value concentrates:
-
Fewer coordination errors before construction. Visual tools reduce uncertainty and improve stakeholder approvals by facilitating real-time coordination. When a mechanical contractor can see a 3D clash between their ductwork and a structural beam before fabrication begins, the cost of resolution drops from a field change order to a model edit.
-
Faster client approvals. Clients who can walk through a photorealistic model of their building before it exists make decisions faster and with more confidence. Ambiguity about ceiling heights, corridor widths, or material selections disappears when the client has experienced the space virtually.
-
Stronger stakeholder alignment. Interactive BIM visualization aligns stakeholder viewpoints with project-specific questions, shifting focus from aesthetics toward constructability and design interaction. A planning board reviewing a mixed-use development understands massing and context far better from a 3D model than from a set of elevation drawings.
-
Reduced project risk. Pre-construction visualization surfaces design conflicts, accessibility issues, and constructability problems at the stage when they are cheapest to fix. The importance of BIM visualization in risk reduction is measurable: issues caught in the model cost a fraction of what the same issues cost in the field.
-
Enhanced marketing and pre-sales performance. Real estate developers use photorealistic BIM visualization outputs to sell units before construction begins. A buyer purchasing off-plan based on a compelling walkthrough video is making a decision grounded in accurate, data-derived visuals rather than a sales brochure sketch.
-
Support for regulatory submissions. Planning authorities in many jurisdictions now accept or prefer 3D visualizations alongside traditional drawings. A well-prepared BIM visualization package can accelerate approval timelines by giving reviewers the spatial context that 2D plans cannot provide.
How does BIM visualization differ from traditional CAD and rendering?
The distinction between BIM visualization, traditional CAD, and standalone rendering is not just technical. It reflects a fundamentally different approach to how project information is created, shared, and used.
Traditional CAD produces 2D drawings: floor plans, sections, elevations, and details. These drawings are accurate representations of design intent, but they require significant expertise to interpret. A client, a planning officer, or a facilities manager cannot intuitively read a CAD section drawing the way they can navigate a 3D walkthrough.
Standalone rendering, produced outside a BIM workflow, creates photorealistic images from geometry that is often modeled specifically for visual output rather than data accuracy. The result looks convincing but carries no embedded project information. If the design changes, the render must be rebuilt from scratch.
BIM visualization combines the accuracy of BIM authoring with the communicative power of high-quality 3D output. BIM encompasses a holistic process managing physical and functional information in an intelligent 3D model, with visualization acting as the communication layer over this data. The geometry in a BIM visualization is the same geometry the structural engineer analyzed and the contractor will build from. This single-source-of-truth principle is what makes BIM visualization a coordination tool rather than just a presentation tool.
| Method | Data accuracy | Interactivity | Stakeholder accessibility |
|---|---|---|---|
| Traditional CAD | High | None | Low (requires expertise) |
| Standalone rendering | Low (geometry only) | Limited | High |
| BIM visualization | High (model-linked) | High | High |
3D models are essential for builders precisely because they close the gap between technical accuracy and stakeholder comprehension. BIM visualization achieves both simultaneously.
Key takeaways
BIM visualization is the communication layer that transforms intelligent BIM models into interactive, data-rich visual outputs, making it the most effective tool for coordination, client engagement, and risk reduction in architecture, construction, and real estate projects.
| Point | Details |
|---|---|
| BIM visualization defined | It converts data-rich BIM models into interactive 3D outputs for stakeholder communication. |
| Four core techniques | Real-time navigation, linear walkthroughs, interactive tours, and static renders each serve distinct project needs. |
| Data beyond geometry | 4D, 5D, and sustainability data layers make BIM visualization a coordination tool, not just a presentation format. |
| Practical benefits | Fewer field errors, faster approvals, stronger alignment, and better pre-sales performance are all direct outcomes. |
| Distinction from CAD and rendering | BIM visualization combines model accuracy with high accessibility, unlike CAD drawings or standalone renders. |
What Rendimension has learned from BIM visualization projects
The most common misconception we encounter is that BIM visualization and BIM authoring are the same workflow. They are not. The authoring model is built for accuracy, data integrity, and multidisciplinary coordination. The visualization model is built for clarity, impact, and communication. Treating them as identical leads to cluttered, confusing visuals that fail both audiences.
What we have found across more than 1,000 projects is that the most effective BIM visualization work starts with a clear brief about the audience and the decision being supported. A contractor reviewing a construction sequence needs isolated views, camera paths that follow the build logic, and 4D overlays. A real estate buyer needs photorealistic materials, natural light, and a sense of scale. Producing the same output for both audiences wastes the potential of the BIM model.
The shift toward immersive web-based visualization is the development we are watching most closely. Large projects increasingly use browser-accessible 3D viewers that let non-technical stakeholders explore BIM data without specialized software. Combined with VR walkthroughs, this approach removes the last barrier between a complex BIM model and the people whose decisions shape the project. The firms that master this communication layer will have a measurable advantage in client confidence and project delivery.
— Rendimension
How Rendimension brings BIM visualization to life
Rendimension specializes in converting BIM models into production-ready visual outputs that serve real project goals, from planning submissions to pre-sales campaigns and contractor coordination packages.
Our 3D rendering and visualization services are built around the same principle that defines effective BIM visualization: accuracy and clarity working together. We produce photorealistic exterior and interior renders, immersive 3D walkthrough experiences, and real-time navigation assets directly from your BIM data. Every output is tailored to the specific audience and decision it needs to support. Whether you are presenting to investors, seeking planning approval, or aligning a multidisciplinary project team, Rendimension delivers visuals that make your BIM model work harder for your project.
FAQ
What is BIM visualization in simple terms?
BIM visualization is the process of turning a data-rich BIM model into interactive 3D images, walkthroughs, and real-time scenes that all project stakeholders can understand. It acts as the communication layer between technical model data and the people who need to make decisions based on it.
How does BIM visualization differ from a regular 3D render?
A regular 3D render is a static image produced from geometry modeled for visual purposes only. BIM visualization outputs are linked to the actual project model, carrying embedded data on materials, costs, and structure, making them accurate coordination tools rather than just presentation assets.
What software is used for BIM visualization?
Autodesk Revit is the most widely used BIM authoring platform, while real-time visualization tools like Enscape connect directly to the model for live navigation. For production-grade photorealistic outputs, project teams typically work with specialist visualization studios like Rendimension.
What are the main benefits of BIM visualization for construction projects?
BIM visualization reduces coordination errors, accelerates client approvals, improves stakeholder alignment, and supports pre-sales marketing for real estate developments. It surfaces design conflicts at the model stage, where resolution costs are lowest.
Can BIM visualization be used for facility management after construction?
Yes. BIM models linked to asset data allow facility managers to navigate the building visually, access equipment specifications, and plan maintenance workflows. This lifecycle application is one reason large infrastructure clients now require BIM deliverables as a contractual standard.